- Home
- Case Studies
- Distributed Tracing
Distributed Tracing

Distributed Tracing
These days, systems are more and more distributed, usually build in microservices architecture or serverless architecture. Services are built with different languages, frameworks, running on the cloud, frequently running within the containers, deploying at least two replicas for high availability. A system can be built with hundreds or even thousands of components. That's why the observability is one of the most important parts of the solution. Without this, it is very difficult to have a reliable system. In my private opinion it is not possible to ensure high SLA for this kind of product without observability.
Observability
We can find many different definion of "observability", but I like the shortest one by Steve Waterworth from Instana:
"If you are observable, I can understand you."
The one of the biggest different between "monitoring" and "observability" is that monitoring gives you infomration whether the system works and allows you to quick respond when issues occur. Observability give you posibility to ask why it's not working. So' it provides information when an error occured, but why. Thanks for that, you can quickly resolve that problem.
What is the distributed tracing?
in a nutshell: a method for tracks the single request which runs through distributed components such as applications, message brokers, databases, etc.
The additional advantage is that we can monitor latency in our whole system. Thanks to the distributed tracing we are able to know which exact component (even method) is the source of latency in our solution.
At the begining, we need to defined the basic term of the distributed tracing:
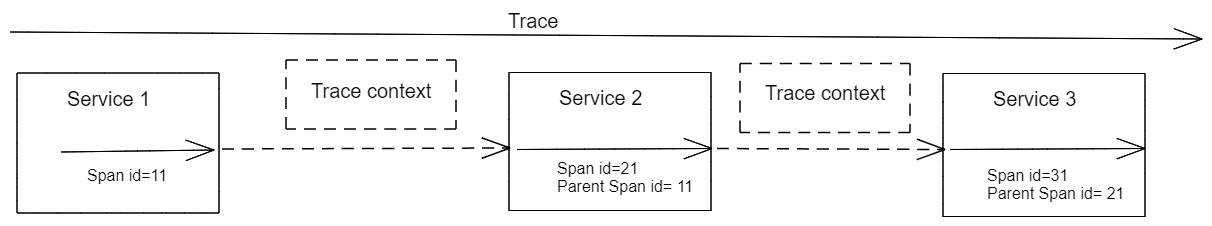
Span - is the most important part of the distributed tracing. It's a timed unit of work of the whole workflow. In other words, it's a single call between two components (or methods, - depends how we instrument our application)
Trace - is a collection of spans. Represents a whole trace of the request which moves through a distributed system.
Span Context - called also "trace context", contains the trace information (e.g. trace and span IDs, tags, etc.) which is required to correlate the individual spans. The span context is shipped with a request between two components that take part in a particular tracing.
And now, let's try to visualization the distributed tracing:
How the span context can be progagated?
- B3 Propagation- is a Zipkin specification, which defines headers starts with "x-b3-"
- Baggage- mechanism which is used by Jaeger for instance
- a custom solution of a particular tracing vendor - some tracing vendors can implement their own solutions,
- W3C Trace Context- this standard is an answer for the individual implementation by each tracing vendors.
Instrumentation
The instrumentation we can dived intothe two major types:
- auto-instrumentation
- manual.
Auto instrumentation allows us to not add any dependencies to our application. One we need to do is to use a dedicated agent (dedicated library) depending on programing language which is used to write the application. An exception of this is, for example, Spring Sleuth, which automatically adds the tracing to our spring application, but we need to add the dependency to it.
In most cases, the auto-instrumentation can be enough, but when we want to have more precise information about the tracing, or some piece of code needs to be treated as a separate span, we need to instrument our application manually. There are several differents clinets libraries for instrumentation, such us:
OpenTracing, OpenCensus, OpenTelemetry
Because the distributed systems are and more popular thanks to Microserces architecure developers have started using different tools for distributed tracing. There was a need to create a standard for consistent solutions.
Either OpenTracing and OpenCensus creating standard for distributed tracing and are vendor-neutral such us: Zipkin, Jaeger, Datadog, etc., but there are some difference. The biggest one is that OpenTracing provide uniform API for tracing and integrate backends (Jaeger, Zipkin, etc.). OpenCensus has exporters which can used to export data to tracers (Jager, Zipkin, etc.). Additional OpenCensus supports metrics, OpenTracing only tracing. Beause of these differences, developers have to choose one of them. That's why in 2019 the OpenTracing and OpenCenses have merged into the one, the new project - OpenTelemetry.
OpenTelemetry is part of the CNCF, and collect all the goodness from the OpenTracing and OpenCensus. It starts to be a standard for distributed tracing and provides a set of libraries, agents and APIs to capture tracing and matrics. Has an integration with backends such as Zipkin, Jaeger, Prometheus, etc., so the traces and metrics can be sent to them and analyzed.
Summary
in distributed systems era, the distributed tracing starts to be a crucial part. Standard approaches, which had make sense in monoliths such log to files, manual testing with QA teams, etc. are falling out of use. Modern systems can contain hundreds of microservices which handle with a huge number of requests per day. To effectively manage that kind of system, it's required to implement Observability. One of the pillars of it is the Distributed Tracing. Thanks to that, we exactly know the routes of the requests and latency in particular services, components or even methods.