- Home
- Case Studies
- Effective log management with Elasticsearch

Effective log management with Elasticsearch

Challenges of log analysis today
In the past, when most applications were built in monolith architecture, surely some of you remember how you managed logs. The application was deployed on a few servers, and in a case when some errors occurred, usually the logs were downloaded and searching errors e.g. via grep tool, within the all log files from all servers.
Currently, modern systems are built mostly as distributed systems (microservices, cloud-native, etc) and can be deployed in different zones on a cloud, within the containers:
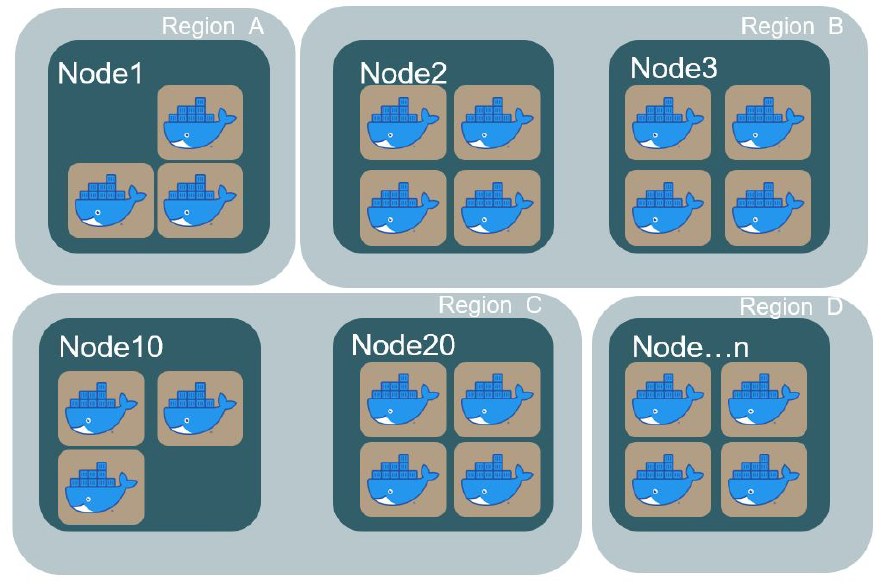
In that case, it is not possible to find issues effectively using the old-style approach. That's why the more sophisticated approach of log managed is needed - central log management:
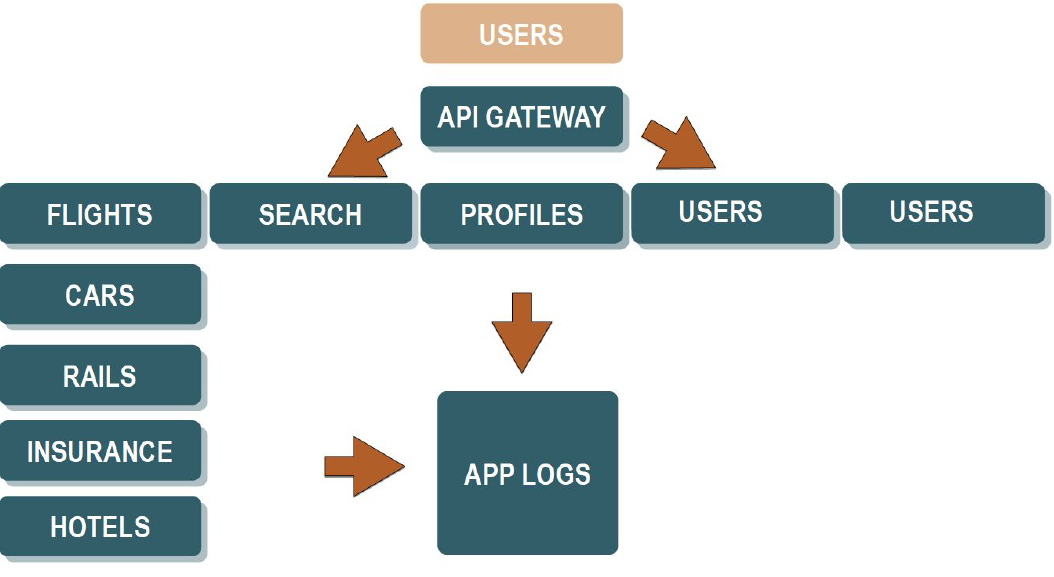
In this approach, all logs from all services send into the one, central place. From the one place can search, monitor and analyze the logs. Please have a look at the example below:
Indices, Shards, Segments
At the beginning we need to clarify what indices, shards and segments are.
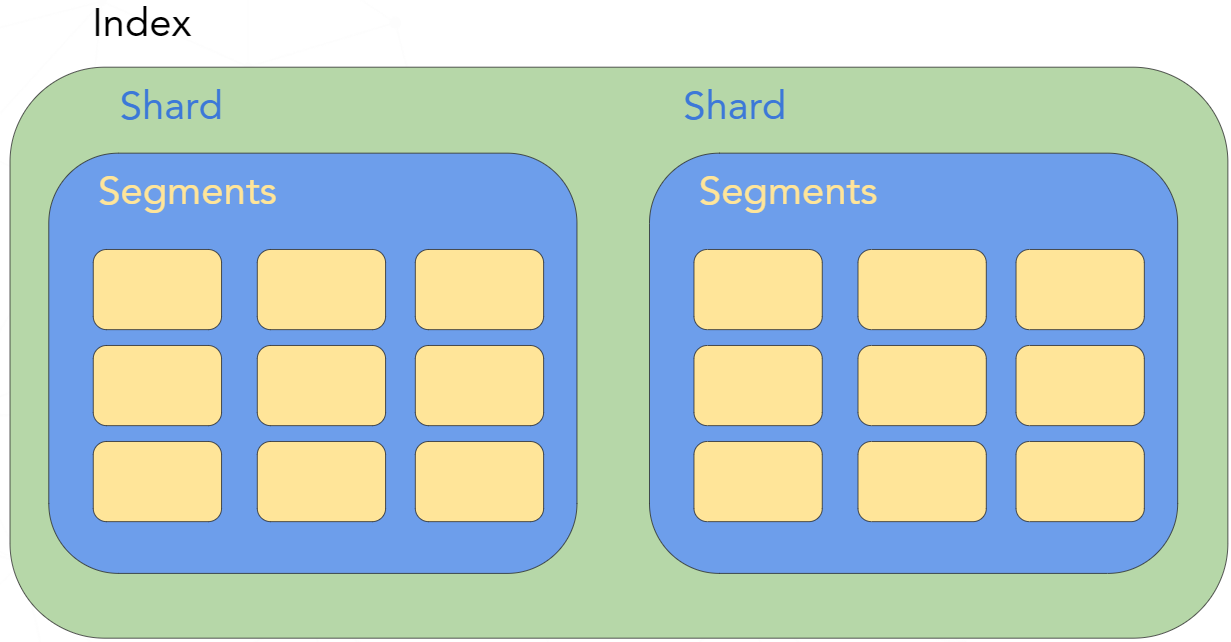
- Index - is a logical namespace for data. It groups shards (one or more)
- Shard - is a Lucene instance
- Segment - a shard contains one or more segments. The segment is an immutable sub-index, which represents an inverted index for each field
Logs - good practises
The set of below's rules are collected based on our experience during working on the log management system:
- normalize your logs (e.g. use the JSON structure)
- use the same time zone in logs (within the entire services)
- take care about the sensitive data
- use the correlation identifiers (very useful in distributed systems)
- log only important/useful data
Planning cluster and designing indices
During the planning of Elasticsearch's cluster and capacity planning, it is good to take into account the following items:
- what your logs look like
- the logs size: more or less constant or various
- optimal size of shard
- how many primary shards/replicas?
- indices: daily, weekly, monthly, fixed size?
- how you are going to search your data?
- index templates
- aliases
Index template
When you preapring the index tempate, please have a look at the following settings:
- refresh_interval - set the right refresh interval. If you havae havy indexing, you need to increase the interval accordingly,
- disable dynamic mapping - when you don't have full control of what type of data are send into your index, sometimes its good to disable dynamic mapping and treat all unmapped fields as a string.
- use the right data type - preparing mapping for your fields, please choose the right data type. For example, in some cases you don't need to have full-text search - the exact match will be enough.
Schema for common logs
The following schema is just a proposal as a common schema for logs. This has been created based on our experience with a log management solution:
| Field name | data type |
|---|---|
| message | text |
| serviceTagName | text/keyword |
| loglevel | keyword |
| traceId | keyword |
| spanId | keyword |
| <specific_service> | JSON object |
Example of index template
How to start?
- create a initial version of your index (based on planning)
- start indexing your data
- start monitoring size of your shards, resources, cluster
- check the queries/aggregations speed
- tune your cluster/indices/settings
- test and validate your solution!
Start using your first configuration on production, monitor your system and tune the settings if necessary. Your cluster should live and should be constantly improved.
Architecture of deployments
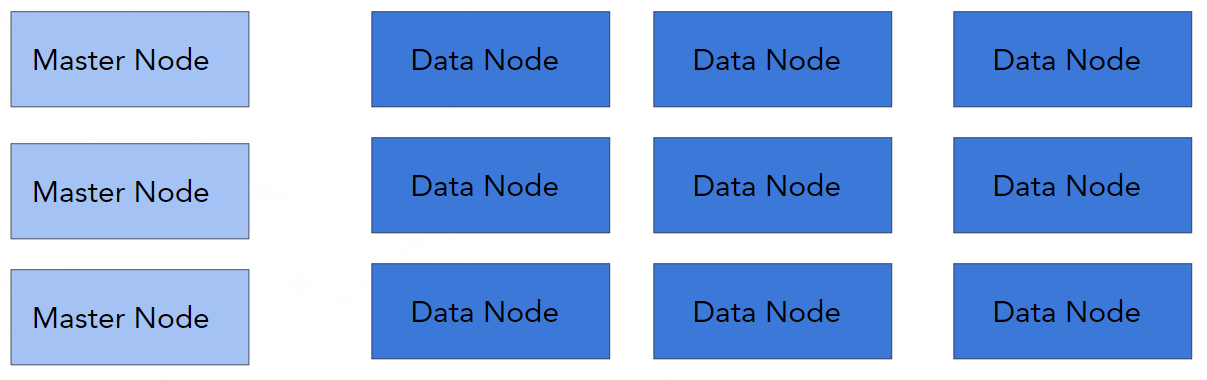
Uniform architecture
In this architecture, we have a dedicated "Master" and "Data" nodes. In depends on use cases, sometimes the additional dedicated nodes are needed, such as coordinating or ingest or machine learning.
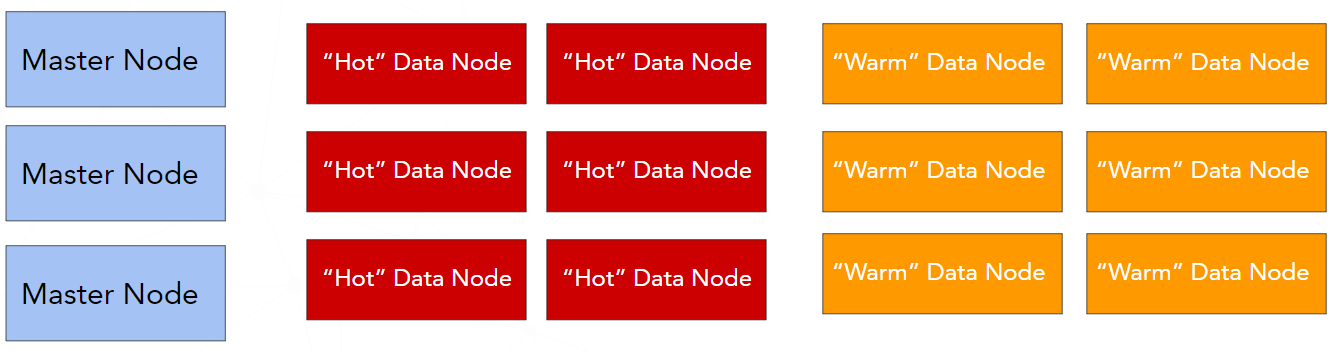
Hot-warm architecure
This architecure is very popular, espacially when we are working with time-based data like logs for instance. In this case, we are spliting our data nodes into the two types:
- hot- for the latest data. These nodes are writable and searchable (usually placed on fast, SSD disks),
- warm - for older data. These nodes are read-only and can be placed on cheaper disks
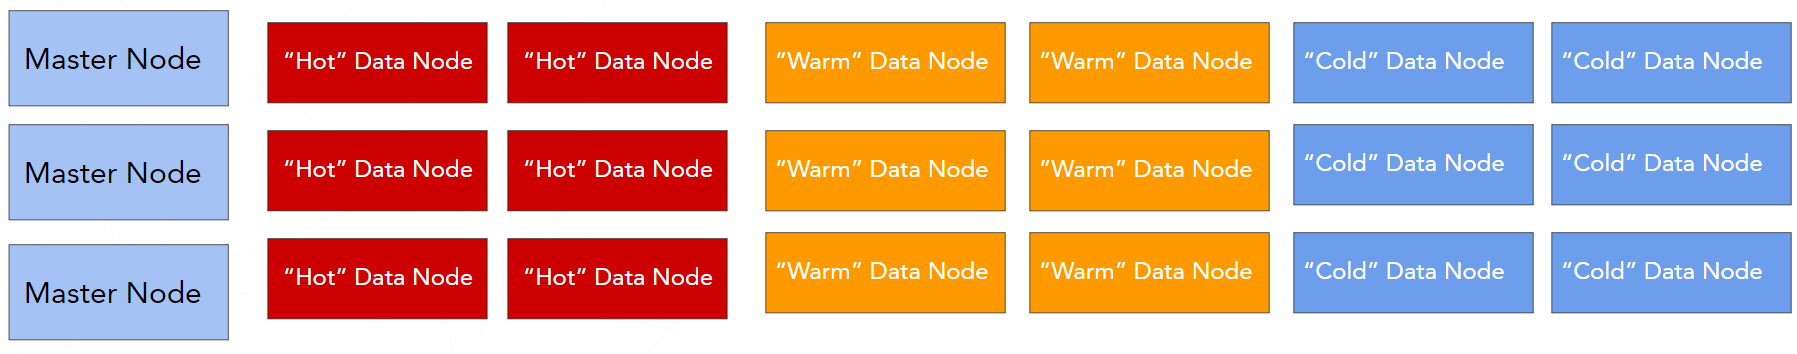
Hot-warm-cold architecure
This architecture is available with the x-pack, so you need to pay for it. This type of architecture is very similar to "hot-warm". The difference is that the additional type of data node is available - "cold" data node. The "cold" nodes hold time-based data that are ready-only and not searchable often. They contain a "freeze" indices.
Building an efficient log system at scale - for free!
The following hints are collected based on our experience with building a real, production log management system based on Elasticsearch, using open-source components.
1. Split your indices to "hot" and "warm"
- “hot” indices- the latest ones: writable and searchable
- “warm”- read-only, contains older logs
- the right amount of the primary shards (more for “hot”, less for “warm”)
- splitting based on “writing time range”
2. Shrink the shards
move one copy of shards to a single node
do the shrink
3. Force a merge of segments
4. Increase the number of replicas
5. Switch aliases
6. Remove the "hot" indices
7. Use Curator as a managing tool for your indices
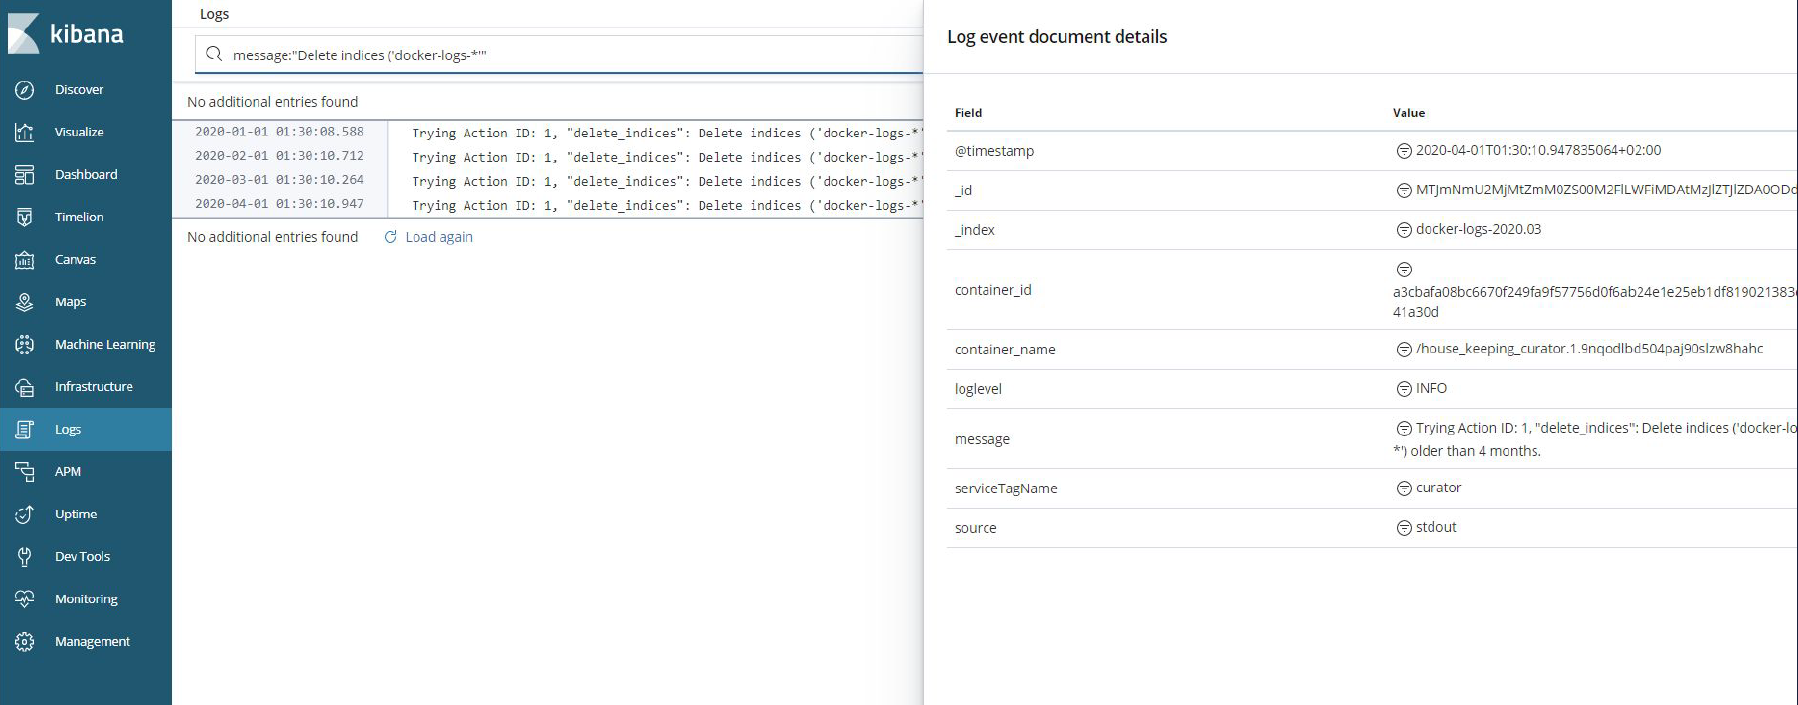
Elasticsearch Curator helps manage Elasticsearch indices. For more details, please have a look at the official documentation site.
Example of action for deleting indides with name starts with "docker-logs-" and older than 4 months:
Summary
Base on our production experience, I have tried to share our knowledge with you, about how the Elasticsearch can help you to build efficient and scalable log management for free. If you are planing build a similar solution in your organization, please take into account the following items:
- take time for good planning,
- normalize your logs,
- use the same time zone for all logs (UTC is more than welcome),
- you must know your logs,
- the right balance between the number and size of shards,
- choose the right solution architecture,
- monitor your cluster (shard size, heap space size, etc.),
- automate the managing your logs (e.g. curator),
- don't forget to add alerting!